What is CFS Remission Site About?

I have been observing the Myalgic Encephalomyelitis/Chronic Fatigue Syndrome (ME/CFS) community for almost 35 years. I have been an active member of this community. I have also been in remission for it, but deeply interested in understanding it; I have had several relapses. I wanted to prevent future relapses hence great interest in reading and researching.

Microbiome Analysis as a path with good results

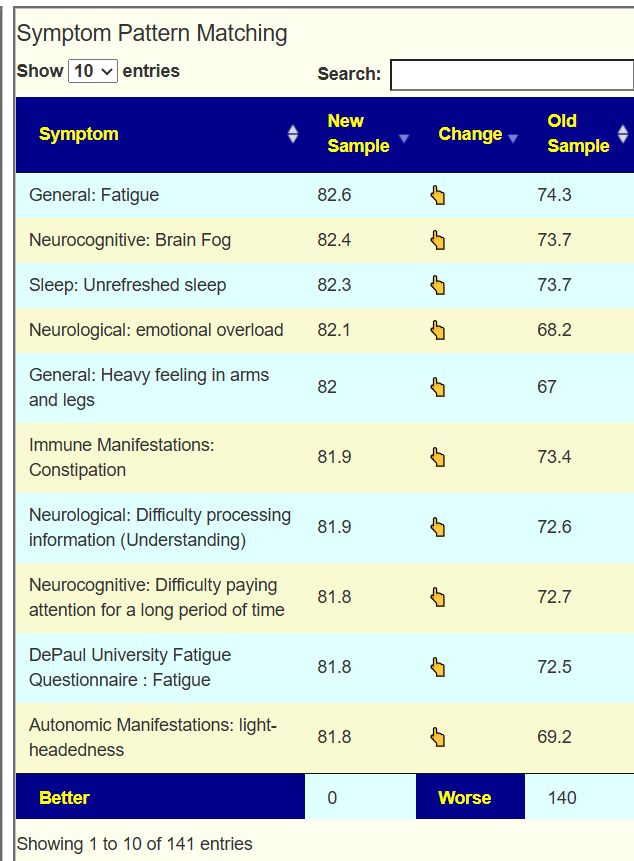
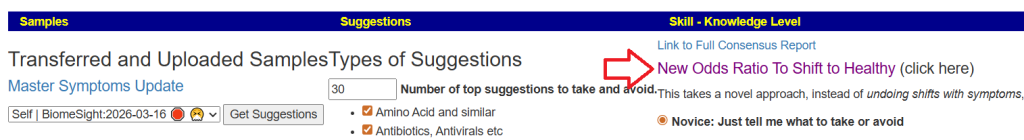
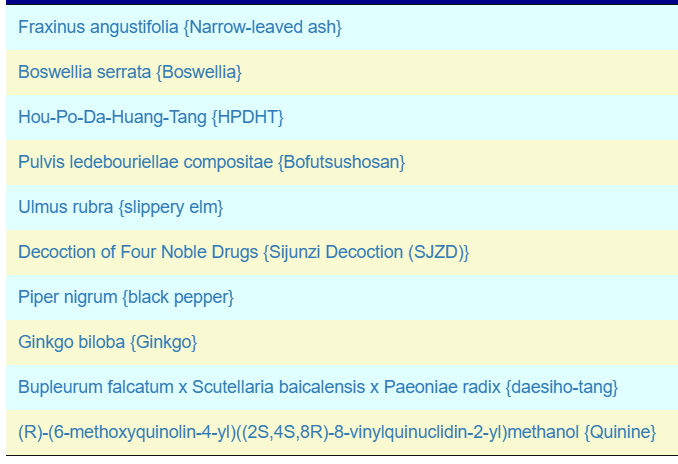
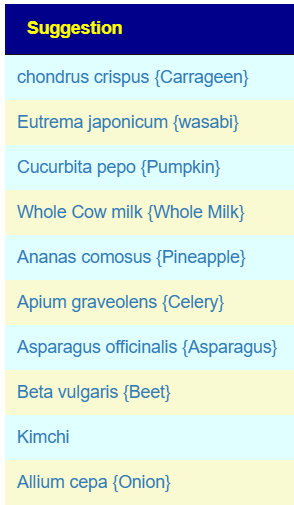
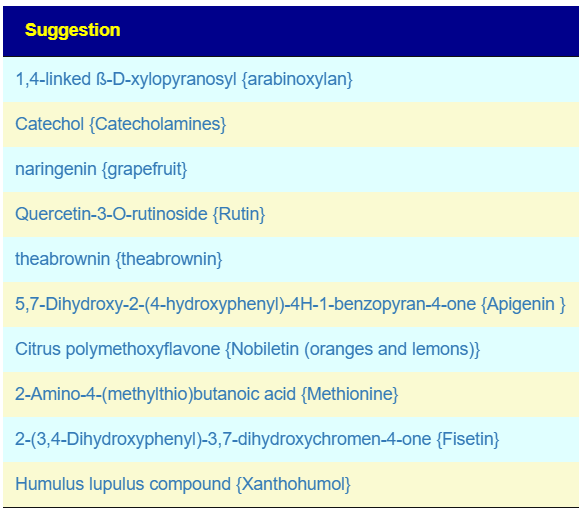
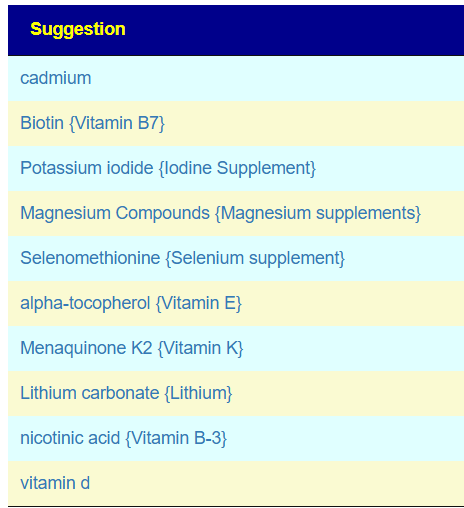
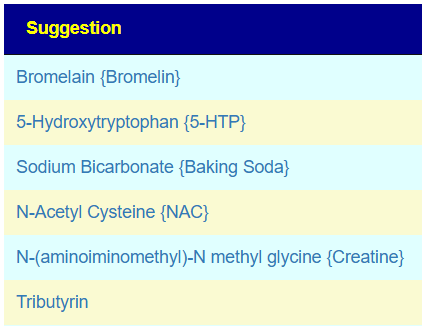
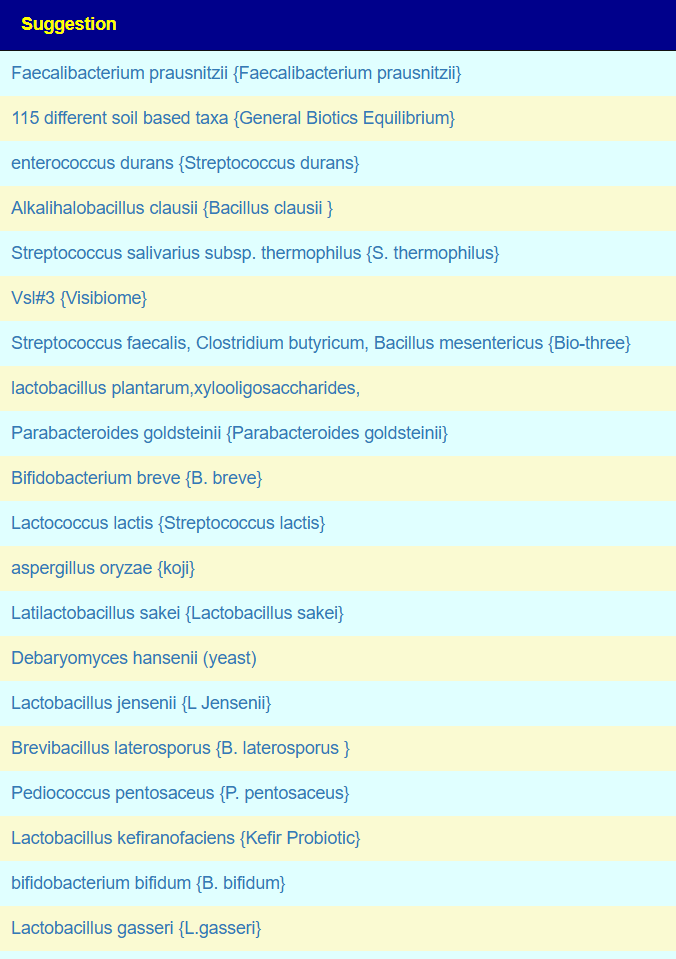
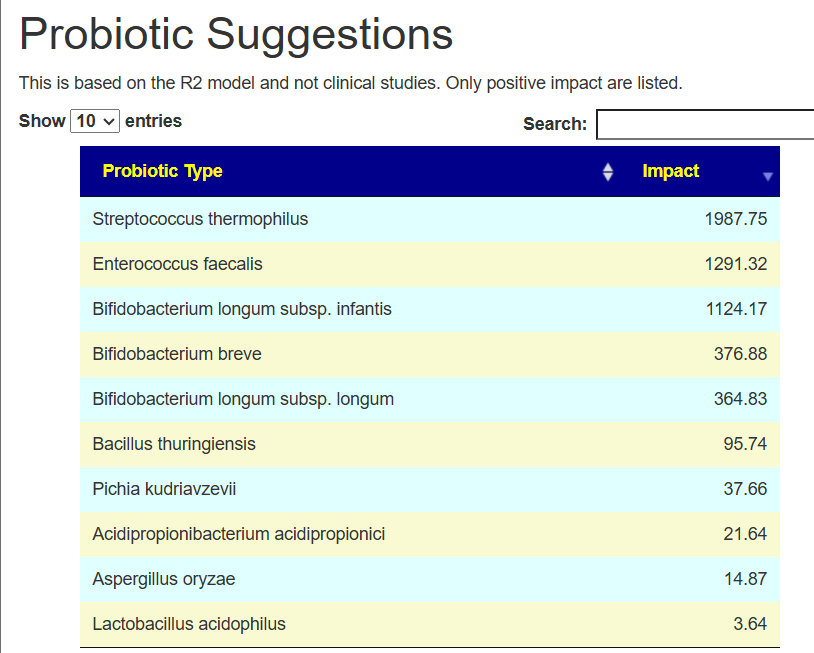
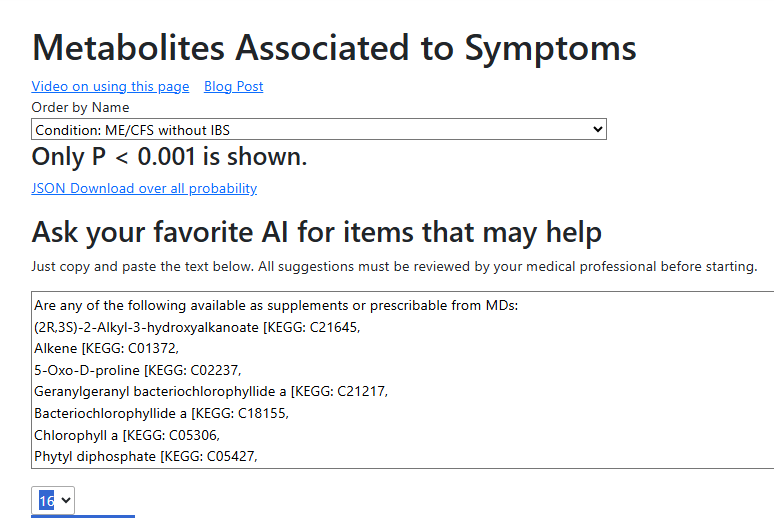
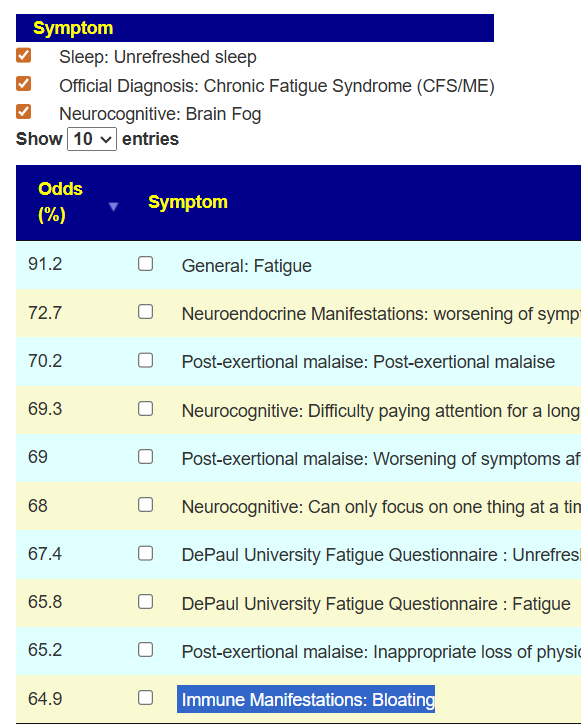
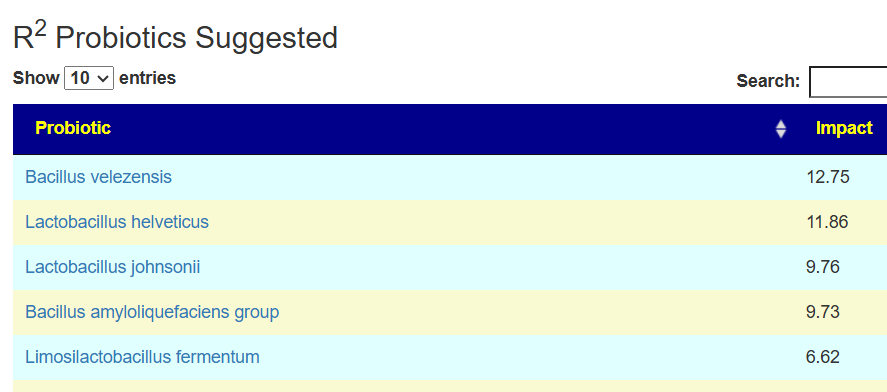
My main focus in 2023 is on the microbiome of ME/CFS people. I have a collections of reviews of individual microbiome samples reviews available. The data from the suggested tests are processed using the free expert system at Microbiome Prescription. So far, every person who has done this route and repeated the microbiome tests have reported subject improvement and objective improvement. It can be a long journey, we take one step at a time.

During those decades I have seen a huge number of theories, suggested treatments and clinical findings. I have seen many “this cured me” which failed to deliver remission for anyone else. I have seen treatment plans proposed / sold by well-meaning MDs that worsen the condition and persisted for years. I see this still going on today for both ME/CFS and Long Hauler COVID.

My training is in science: mathematics, statistics, general sciences. I have been an instructor in those areas at many universities, colleges and even high schools. My remissions resulted from following gold or silver standard evidence. I have read several thousand published papers on ME/CFS (with and without brain fog).

What is on this site?

Most of the posts results from reading a new paper, readers asking questions, seeing a question asked on some online groups. The posts follow this pattern:

  • The question or concern that started the post
  • A review of all literature on the US National Library of Medicine, conference papers, etc.
    • Quotes provided from papers or their titles
    • Links to the paper so people or their medical professionals can read for themselves
  • A bottom line section which are my conclusions inferred from the literature.

To quote Seargent Friday from the old Dragnet TV Series, “All we want are the facts, ma’am“.

Use the site as an Encyclopedia

There is another similar site, Encyclopedia Myalgic encephalomyelitis, [me-pedia.org], which I also use. I actually have had more page views than that site! What the difference? I seem to cover things in more depth. I just searched for “grapeseed” on that site and found nothing. I searched on this site and literally had dozens of posts cited. Resveratrol Revisited [2015], Resveratrol Recap [2017], Mast Cell Moderators — non-drugs and suspect bacteria [2023]

The fastest way to find information is to go to google search, enter site:cfsremission.com followed by what you are interested in.

I Promote No Protocol, I promote evidence based treatment.

As a statistician, I recognized that ME/CFS consists of many, many, many, different subsets. To treat successfully means getting information. I know that my own ME/CFS was usually triggered by the interaction of an inherited coagulation defect (Prothrombin G20210A a.k.a. Factor II Mutation) interacting with stress and a microbiome that goes bad with stress. What works for me may not work for another with ME/CFS.

My Unified Model of ME/CFS and Long COVID

I have a hypothesis on the causes of ME/CFS and a treatment approach (not a protocol) that is likely to reduce the severity of ME/CFS. Some may go into remission.

The Cause of ME/CFS

The cause is rather simple: anything that causes an alteration of the microbiome. This may be food poisoning , an infection (COVID, Flu, Lyme, Epstein-Barr virus), a vaccination, a prescription or over the counter drug, pesticides, bad diet. This alteration and happenstance cascade into a microbiome dysfunction that mucks up your system. Too much of some metabolites /chemicals are being produced, too little of others, the chemicals used by the body are “hacked” and the body manifests a huge variety of symptoms.

Treatment Approach

Over the 30+ years, I have been a good mathematical modeler. Trying to find a model that agrees with all of the facts, explains all of the observations and last, can make predictions that are testable. Not that many years ago I came to the realization that the microbiome dysregulation model was an extremely good fit. More important, it made predictions that could be tested.

A 1999 study in Australia found a common pattern with ME/CFS patients microbiome. If something helps ME/CFS then it is likely that this same thing would influence the bacteria found to move closer to normal. This post from 2013, Finally! Someone verified the 1999 Studies – Thank you Kenny De Meirleir! shifted me further down this path. Finding that the most effective antibiotic protocols for ME/CFS and Lyme would also correct the reported microbiome function (see Why Jadin’s Antibiotics Protocol usually work — Pasteur Institute got the solution right and the explanation wrong? ).

I keep monitoring ME/CFS studies. My current effort is dealing with improving the ability to correct the microbiome. This is done on a separate site, Microbiome Prescription, and a separate blog site.

I have a page linking to people experience with this approach. Each person is different.

Analysis Posts on Long COVID and ME/CFS

I believe that most ME/CFS people will improve significantly with microbiome testing followed by appropriate adjustments. This is often an iterative approach (test-adjust-repeat).

Overview of this Blog and the Microbiome

My ideas on this blog have evolved, as more and more information becomes available. This post is an attempt to bring readers up to date with my current thinking. I am striving to be transparent in my logic — showing the evidence I am working from, and my thought processes.


Notes to Treating Physicians     Quick Self Start on treating CFS


Analysis of Microbiome/stool with recommendations

Site: has moved to https://microbiomeprescription.com/

  • Over 30 different tests are supported. See this page

The data is available in an online collaborative python workbook for analysis. See this post.


Microbiome Definition of CFS/FM/IBS

A coarse condition that results from:

  • Low or no Lactobacillus, AND/OR
  • Low or no Bifidobacteria , AND/OR
  • Low or no E.Coli , AND/OR
  • A marked increase in number of bacteria genus (as measured by uBiome) to the top range
    • Most of these genus are hostile to/suppress Lactobacillus, Bifidobacteria, E.Coli
    • Several are two or more times higher than normally seen
    • The number of bacteria genus goes very high (using uBiome results), but most of them are low amounts.
      (“Death by a thousand microbiome cuts” and not “Death by a single bacteria blow”)
  • The appearance of rarely seen bacteria genus in uBiome Samples.

A finer definition would be a condition with a significant number of abnormalities in the ‘Autoimmune profiles see this page for the current criteria (i.e. over 25%).

The specific genus and their interactions determine the symptoms seen — likely due to the over- or under-production of metabolites (chemicals). Other autoimmune conditions may share these core shifts. The specific high and low bacteria determine the symptoms if the person was the DNA/SNP associated with the symptoms.

Replace the metabolites produced by the missing bacteria

Replacing the metabolites should result in the reduction of symptoms associated with a deficiency of these metabolites.

See this post for the study references. These items should/could be done continuously.

Other Supplements Reported to Help

Bootstrapping Bifidobacterium and Lactobacillus

The items below were found in studies to increase bifidobacterium and lactobacillus:

Unless the bifidobacterium and lactobacillus (B&L) are human sourcedthere is almost zero chance of taking up residency. Taking probiotics will not allow B&L to get established. In fact, there are grounds to believe that most commercial probiotics actually reduce your  native B&L. You want to encourage your native B&L. See this post for citations.

Bootstrapping E.Coli

The E.Coli probiotics below are human sourced and known to take up residency in the human gut.

  • Core: D-Ribose a preferred food that it uses
  • Mutaflor probiotics — E.Coli Nissle 1917
  • Symbioflor 2 — multiple strains

Dealing with the other microbiome shifts

The other microbiome shifts appear to be in different clusters of microbiome shifts. This 2017 paper by Peterson, Klimas, Komaroff, Lipkin (and a stack of other CFS researchers) makes that clear in its title: “Fecal metagenomic profiles in subgroups of patients with myalgic encephalomyelitis/chronic fatigue syndrome”.

The best way at present to proceed is to order an analysis from uBiome. (Disclosure: I have no financial interest in this company.) When your get your results back, log in, click on the “Compare” tab, then go to “Genus,” and click on “ratio” twice, so the results are in descending order.

This is the “hit list” of what you are trying to reduce. DataPunk provides a nice summary of what we know about these. See, for example, Alistipes:

At this point, we run into a logistical challenge.  You want to avoid items that are “Enhanced By” (which is in common across all of the high items) and take the items that are “Inhibited By” (which are not on any of the “Enhanced By” lists).  You may also wish to reduce foods that are high in items listed in “Nutrients/Substrates.”  It becomes a jig-saw puzzle! I have done this exercise for many readers’ uBiome results:

I have discovered that DataPunk is not absolutely current, and have started creating posts based on its data, and then added studies from 2016 and 2017 to the page. Past pages are below, for current list MicrobiomePrescription site.

General Suggestions (no uBiome results)

Some of these items are contraindicated with a few uBiomes that I have reviewed. This likely is why person B reports no results while person A reports improvement. Example: Magnesium is usually very helpful — but there are a few cases where it encourages overgrowth of undesired  bacteria.

Probiotics

Most probiotics do not take up residency. They are “here today, gone tomorrow”. Their primary role in my model is producing natural antibiotics against other bacteria. For example:

Probiotics should be rotated: 2 weeks on a specific one, then several weeks off. As a general rule, you want about  6-12 B CFU taken three times a day (or 2-3 times the recommended dosage) — but work up slowly because you may get be a major herx! In general, do not take Lactobacillus with Bifidobacteria or with E.Coli etc. Keep to one family per cycle. You do not want them to kill off one another!

Why 3x per day? Because almost none of them are detected after 12-24 hrs. So to keep them — and the production of natural antibiotics — going, you need to keep taking them during the day. See this post for citations.

The following probiotics commonly seem to help people with CFS/Lyme/Fibro:

Some probiotics, however, may make your symptoms worse! And, unfortunately, most commercial probiotics contains some of these. At the moment Bifidobacterium animalis, Saccharomyces boulardii and Lactobacillus acidophilus are on my best to totally avoid list.

  • “. The findings show that the six species of Bifidobacterium differed in their ability to relieve constipation. B. longum, B. infantis and B. bifidum were the most effective in relieving constipation, B. adolescentis and B. breve were partially effective and B. animalis was not effective. Furthermore, edible Bifidobacterium treated constipation by increasing the abundance of Lactobacillus and decreasing the abundance of Alistipes, Odoribacter and Clostridium. .” [2017]

On my neutral list (no clear benefit) is Lactobacillus Plantarum.

Teas

Some teas can also be antibiotics (among other roles). There are two teas that seem to produce significant results quickly:

Again, rotate and, if practical, change brands too. Their antibiotic compounds are different from different sources.

Herbs and Spices

The best choice needs examination of your microbiome (i.e. uBiome results) and doing the work cited above.  Survey results found:

  1. Neem and Oregano with 80% improving
  2. Olive Leaf and Licorice with 56% improving
  3. Thyme with 50% improving
  4. Wormwood and Tulsi with 33% improving

Other things

If you do not know your microbiome, then see https://cfsremission.com/reader-surveys-of-probiotics-herbs-etc/  for suggestions. Your results will vary because your microbiome vary.

Thick blood is an issue also — but here things gets more complicated and not suitable for this recap.

Antibiotics can have a role — but getting prescriptions for the right ones can be a major challenge.

Metabolism Shifts

From volunteered data, we can identify some distinctive shifts, see Metabolism Explorer Summary

Bottom Line

Working with the microbiome and autoimmune is like working with fragments of the dead sea scrolls. For many bacteria we can identify it — what inhibits or encourages it is not known to modern medical science.  We have extremely thin slices of knowledge –Almonds enhances Bifidobacterium, Lactobacillus (B&L)  as do sesame seeds. What about sunflower seeds? Peanuts? Cashews? We find that Walnuts help the bacteria that inhibits B&L — so we cannot safely generalize to “all seeds/nuts are helpful”.

In many cases, we find that healthy diet or supplements demonstrated to work for normal people have the opposite effect on CFS and other altered microbiome conditions. This is made even worst because most of the studies were done on males and most people with CFS are females. We end up having to swim up-stream thru good and valid suggestions — that are just wrong for us.

My model is simple to understand and allows us to filter many suggestions and candidates. With the availability of uBiome testing (without needing a prescription!) we have entered the age of explicit treatment based on your unique microbiome. We do not know the role of many bacteria involved. We do not know what will inhibit or enhanced all of these bacteria. Frustrating little knowledge!

On the flip side, many readers have reported significant improvement, reduction of prescription medication, etc. so the model and suggestions have potential and thus hope of remission! Microbiome studies are exploding on PubMed, a lot of research is being done and we can often borrow their results.

This is an education post to facilitate discussing this approach with your medical professionals. It is not medical advice for the treatment of any medical condition. Always consult with your medical professional before doing any  changes of diet, supplements or activity. Some items cites may interfere with prescription medicines.

Odds Ratio Snapshot: ME/CFS with IBS

This document presents the results of statistical analysis on symptoms from viable, self-annotated Biomesight microbiome samples. The methodology for data acquisition is outlined in New Standards for Microbiome Analysis?. See also:

Tables have been refined to display only genus- and species-level taxa, the 20 most prominent entries per group, and associations achieving statistical significance (P < 0.01).

The following sections provide the processed data, accompanied by guidance on interpretation and application. Counts of significant bacterial taxa are included, reflecting the application of non-standard but rigorously validated statistical approaches to extensive sample and reference populations, where statistical power derives from dataset scale.

SignificanceGenus
p < 0.01198
p < 0.001172
p < 0.0001156
p < 0.00001141

Averages and Medians

I prefer medians over averages. Medians are the values where half of the people have less and half has more. If the data was a bell-curve, then the values will almost be the same… with bacteria that happens rarely. Look at Bacteroides below, we see that the average is above and the median below.

If symptom median is higher than reference median, it means there is more of this bacteria. If lower, then less. This ignores how often the bacteria is seen (we average only over reports).

tax_nameRankSymptom AvarageReference AverageSymptom MedianReference Median
Bacteroidesgenus27.45925.97424.26926.821
Lachnospiragenus3.0932.7061.8862.4
Bacteroides uniformisspecies3.0572.7131.5452.007
Phocaeicola doreispecies3.6672.8650.3950.77
Sutterellagenus1.721.641.241.465
Coprococcusgenus1.241.4420.7370.566
Phascolarctobacteriumgenus0.6740.5780.3960.538
Bacteroides cellulosilyticusspecies1.1940.8350.0750.176
Bilophilagenus0.460.3440.2080.288
Bifidobacteriumgenus0.5390.9560.1290.052
Bilophila wadsworthiaspecies0.450.3360.1980.273
Bacteroides fragilisspecies0.930.8410.050.113
Anaerofilumgenus0.3230.2660.1050.166
Sutterella wadsworthensisspecies0.6080.6620.0610.009
Blautia obeumspecies0.660.5670.2350.189
Hathewayagenus0.3340.2760.1550.2
Hathewaya histolyticaspecies0.3340.2760.1550.2
Mediterraneibactergenus0.7530.7140.2780.321
Bacteroides rodentiumspecies0.4150.390.1860.223
Lachnobacteriumgenus0.3130.3210.0740.042

Bacteria Incidence – How often is it reported

The common sense belief is that if a bacteria is reported more often, then the amount should be higher. This is often not true. The microbiome is a complex thing. Look at Bacteroides uniformis below, we see that the average is above and the median below

tax_nameRankIncidence Odds RatioChi2Symptoms %Reference %
Mogibacterium vescumspecies1.559.227.817.9
Sphingomonasgenus1.611026.116.3
Prevotella biviaspecies1.518.429.119.3
Neisseria mucosaspecies1.8413.42010.9
Sphingobiumgenus1.63818.311.2

More or Less often based on Symptom Median All Incidence

This is a little more complex to understand. If we compute the mid point for people with the symptom, then if the bacteria was not involved then half of the reference should be above this value and half below this value. If not, it means that the symptom tends to over or under growth.

tax_nameRankSymptom MedianOdds RatioChi2BelowAbove
Alcanivoraxgenus0.0020.2759.8378103
Isoalcanivoraxgenus0.0020.2759.836799
Isoalcanivorax indicusspecies0.0020.2759.836799
Niabella aurantiacaspecies0.0020.3352.4533174
Psychroflexusgenus0.0020.350.4356108
Psychroflexus gondwanensisspecies0.0020.350.4356108
Salidesulfovibriogenus0.0020.3247.5387125
Salidesulfovibrio brasiliensisspecies0.0020.3247.5387125
Psychrobacter glacialisspecies0.0020.3745.6658241
Rickettsia marmionii Stenos et al. 2005species0.0020.3443.7395135
Niabellagenus0.0020.3742.5572213
Thaueragenus0.0020.3638.9378137
Viridibacillus neideispecies0.0020.3838.6467177
Thiorhodococcus pfennigiispecies0.0020.3738.4405150
Chromatiumgenus0.0020.3936.6500197
Lentibacillusgenus0.0020.3936.5497196
Thermoanaerobacteriumgenus0.0020.3936.5486191
Chromatium weisseispecies0.0020.3936.4499197
Pontibacillus halophilusspecies0.0020.3836411158
Lentibacillus salinarumspecies0.0020.436481190

More or Less often based on Reference Median All Incidence

This is like the above, but with a different line in the sand. Instead of the median of those with the condition, we use the median of the reference set.

tax_nameRankReference MedianOdds RatioChi2BelowAbove
Oscillatoria corallinaespecies0.0030.3254.6861262
Oscillatoriagenus0.0030.3254.6861262
Methylobacillus glycogenesspecies0.0030.4232.41244493
Tetragenococcusgenus0.0040.44231.81606702
Methylobacillusgenus0.0030.41217.11243512
Parapedobactergenus0.0040.4198.11032414
Parapedobacter koreensisspecies0.0040.4197.61031414
Anaerofilumgenus0.1660.53187.124981335
Erysipelothrixgenus0.0160.54172.321761165
Erysipelothrix murisspecies0.01550.5416521351156
Filifactor villosusspecies0.0060.34161.5588200
Lysobactergenus0.0040.36160.8642231
Psychrobacter glacialisspecies0.0020.37160658241
Niabella aurantiacaspecies0.0020.33156.5533174
Methylonatrumgenus0.0040.53146.31607854
Methylonatrum kenyensespecies0.0040.53146.31607854
Niabellagenus0.0020.37138.7572213
Schaalia odontolyticaspecies0.0030.45128.5783353
Holdemaniagenus0.0260.59128.521551265
Bacteroides heparinolyticusspecies0.0030.49122.1954472

More or Less often based on Symptom Median High Incidence

Above we see that many of the top bacteria identified are sparse, that is not reported often. We then restrict them to those that occur above 50% or the time.

tax_nameRankSymptom Median FreqOdds RatioChi2BelowAbove
Clostridium taeniosporumspecies0.0030.613.31329803
Dethiosulfovibriogenus0.0040.669.21498988
Tetragenococcus doogicusspecies0.0030.6691347891
Hydrocarboniphaga daqingensisspecies0.0040.76.815911112

More or Less often based on Reference Median High Incidence

Above we see that many of the top bacteria identified are sparse, that is not reported often. We then restrict them to those that occur above 50% or the time.

tax_nameRankReference Median FreqOdds RatioChi2BelowAbove
Oscillatoriagenus0.0030.3254.6861262
Oscillatoria corallinaespecies0.0030.3254.6861262
Methylobacillus glycogenesspecies0.0030.4232.41244493
Tetragenococcusgenus0.0040.44231.81606702
Methylobacillusgenus0.0030.41217.11243512
Parapedobactergenus0.0040.4198.11032414
Parapedobacter koreensisspecies0.0040.4197.61031414
Anaerofilumgenus0.1660.53187.124981335
Erysipelothrixgenus0.0160.54172.321761165
Erysipelothrix murisspecies0.01550.5416521351156
Filifactor villosusspecies0.0060.34161.5588200
Lysobactergenus0.0040.36160.8642231
Psychrobacter glacialisspecies0.0020.37160658241
Niabella aurantiacaspecies0.0020.33156.5533174
Methylonatrumgenus0.0040.53146.31607854
Methylonatrum kenyensespecies0.0040.53146.31607854
Niabellagenus0.0020.37138.7572213
Schaalia odontolyticaspecies0.0030.45128.5783353
Holdemaniagenus0.0260.59128.521551265
Bacteroides heparinolyticusspecies0.0030.49122.1954472

Summary

A large number of bacterial taxa exhibit shifts with P < 0.01 in association with this condition. The subsequent challenge is determining how to modulate these taxa, since the volume of candidates exceeds what most individuals can practically consider. Moreover, for many of the taxa identified, there is no published evidence in the U.S. National Library of Medicine describing how to alter their abundance.

A deep optimization model, such as the one implemented on the Microbiome Taxa R2 site, can be used to inform probiotic selection. This model provides coverage for each identified taxon and infers which probiotics are most likely to shift their levels. Its output may then be integrated with more conventional recommendations derived from literature indexed in the U.S. National Library of Medicine where such evidence exists, with the two recommendation sets reconciled by giving priority to probiotic-based suggestions.

Development of a dedicated database based on Biomesight samples is in progress. The current model uses data contributed by PrecisionBiome, and datasets generated with differing laboratory processing pipelines cannot be safely combined, as discussed in The taxonomy nightmare before Christmas…. Once the Biomesight-specific database is complete, an option for generating (offline-only) personalized suggestions will be added to the Microbiome Prescription website.

Probiotics Suggestions

The following are based on a simplified algorithm using R2 data for Biomesight. These are tentative numbers subject to future refinements. Bacteria listed are only for probiotics detected with Biomesight tests. Probiotics include some that are available only in some countries and some that are pending approval for retail sale.

  • Good Count: Number of bacteria expected to shift in desired direction
  • Bad Count: Number of bacteria expected to shift in wrong direction
  • Impact: Estimator of impact based on Chi-2, Slope and R2 vectors
Probiotic SpeciesImpactGood CountBad Count
Faecalibacterium prausnitzii92.3534
Bifidobacterium breve56.65151
Bifidobacterium longum50.98171
Bifidobacterium adolescentis37.32131
Segatella copri15.280
Bifidobacterium bifidum11.81153
Bifidobacterium catenulatum10.46130
Lactobacillus helveticus10.435769
Pediococcus acidilactici8.913643
Bifidobacterium animalis5.4381
Enterococcus faecalis2.23950
Escherichia coli1.3331
Bifidobacterium pseudocatenulatum1.282533
Enterococcus faecium1.22132
Clostridium butyricum1.042122
Streptococcus thermophilus0.932
Limosilactobacillus reuteri0.72536
Limosilactobacillus fermentum0.29109
Parabacteroides distasonis0.2721
Bacillus subtilis0.233833
Lactiplantibacillus pentosus0.19102
Blautia wexlerae0.1421
Lacticaseibacillus paracasei0.09148
Leuconostoc mesenteroides0.081014
Ligilactobacillus salivarius0.0866
Heyndrickxia coagulans-0.081324
Lacticaseibacillus casei-0.0838
Enterococcus durans-0.112121
Lacticaseibacillus rhamnosus-0.16311
Lactobacillus acidophilus-0.441125
Lactobacillus crispatus-0.48528
Odoribacter laneus-1.1805
Limosilactobacillus vaginalis-1.252757
Lactobacillus jensenii-1.412053
Lactobacillus johnsonii-2.23939
Parabacteroides goldsteinii-2.7148
Akkermansia muciniphila-3.27722
Blautia hansenii-59.22110
Bacteroides uniformis-67.6819
Bacteroides thetaiotaomicron-79.7819

Odds Ratio Snapshot: ME/CFS without IBS

This document presents the results of statistical analysis on symptoms from viable, self-annotated Biomesight microbiome samples. The methodology for data acquisition is outlined in New Standards for Microbiome Analysis?.

ME/CFS with IBS is coming!​

Tables have been refined to display only genus- and species-level taxa, the 20 most prominent entries per group, and associations achieving statistical significance (P < 0.01).

The following sections provide the processed data, accompanied by guidance on interpretation and application. Counts of significant bacterial taxa are included, reflecting the application of non-standard but rigorously validated statistical approaches to extensive sample and reference populations, where statistical power derives from dataset scale.

SignificanceGenus
p < 0.01174
p < 0.001155
p < 0.0001137
p < 0.00001128

Averages and Medians

I prefer medians over averages. Medians are the values where half of the people have less and half has more. If the data was a bell-curve, then the values will almost be the same… with bacteria that happens rarely. Look at Faecalibacterium prausnitzii below, we see that the average is above and the median below.

If symptom median is higher than reference median, it means there is more of this bacteria. If lower, then less. This ignores how often the bacteria is seen (we average only over reports).

tax_nameRankSymptom AvarageReference AverageSymptom MedianReference Median
Faecalibacterium prausnitziispecies12.72512.19411.31512.88
Faecalibacteriumgenus13.31512.75711.94513.394
Roseburiagenus2.6222.8461.8111.203
Parabacteroidesgenus3.0562.6091.7162.291
Bacteroides uniformisspecies3.0432.721.5582.035
Phocaeicola doreispecies2.812.9120.4020.806
Oscillospiragenus2.6182.3461.952.273
Novispirillumgenus0.9640.8630.0910.295
Insolitispirillumgenus0.9640.8640.0910.295
Insolitispirillum peregrinumspecies0.9640.8640.0910.295
Parabacteroides goldsteiniispecies0.9450.5560.1310.319
Clostridiumgenus1.9621.8551.3611.533
Parabacteroides merdaespecies0.8570.7410.2970.469
Bacteroides cellulosilyticusspecies1.2220.8410.0750.244
Caloramatorgenus1.2650.9270.1020.22
Bacteroides ovatusspecies1.2581.5230.60.482
Ruminococcus bromiispecies0.8380.7890.1640.269
Pedobactergenus1.2740.9890.5520.651
Bacteroides xylanisolvensspecies0.450.5590.3380.255
Bifidobacteriumgenus0.4340.9530.1260.056

Bacteria Incidence – How often is it reported

The common sense belief is that if a bacteria is reported more often, then the amount should be higher. This is often not true. The microbiome is a complex thing. Look at Dehalobacterium below, we see that is occurs much more often.

tax_nameRankIncidence Odds RatioChi2Symptoms %Reference %
Dehalobacteriumgenus1.477.75638.1
Ammonifex thiophilusspecies1.487.550.734.3
Ammonifexgenus1.487.450.734.3
Pontibacter niistensisspecies1.456.851.335.4
Pontibactergenus1.456.751.335.5
Nodularia balticaspecies2.0314.524.712.1
Nodulariagenus2.0314.524.712.1
Desulfonatronovibriogenus1.9212.82613.5
Microcoleusgenus1.8812.326.714.2
Microcoleus antarcticusspecies1.8812.326.714.2
Paraburkholderiagenus1.546.732.721.2
Roseospiragenus1.627.83018.5
Paraburkholderia phenoliruptrixspecies1.627.629.318.1
Rhodovibriogenus1.576.729.318.7
Rhodovibrio sodomensisspecies1.576.729.318.7
Clostridium acetireducensspecies1.728.123.313.5

More or Less often based on Symptom Median All Incidence

This is a little more complex to understand. If we compute the mid point for people with the symptom, then if the bacteria was not involved then half of the reference should be above this value and half below this value. If not, it means that the symptom tends to over or under growth.

tax_nameRankSymptom MedianOdds RatioChi2BelowAbove
Niabella aurantiacaspecies0.0020.3436.5538182
Psychrobacter glacialisspecies0.0020.3731.7667249
Niabellagenus0.0020.3829.1578222
Viridibacillus neideispecies0.0020.3828.5474180
Thermodesulfovibrio thiophilusspecies0.0020.4520.6538240
Oenococcusgenus0.0020.4520.4611276
Thermodesulfovibriogenus0.0020.4619.3625289
Helicobacter suncusspecies0.0020.4719.2771362
Viridibacillusgenus0.0020.515.3491244
Desulfotomaculum defluviispecies0.0030.5512.21021565
Streptococcus infantisspecies0.0030.5512804443
Hydrogenophilusgenus0.0030.5810.61149664
Alkalibacteriumgenus0.0030.5810.3894517
Pelagicoccusgenus0.0020.5810.2846489
Olivibacter solispecies0.0020.5610.1462261
Salisaeta longaspecies0.0020.5710509290
Treponemagenus0.0030.5710592340
Salisaetagenus0.0020.579.8508291
Sporotomaculum syntrophicumspecies0.0030.599.81111655
Clostridium taeniosporumspecies0.0030.618.91353820

More or Less often based on Reference Median All Incidence

This is like the above, but with a different line in the sand. Instead of the median of those with the condition, we use the median of the reference set.

tax_nameRankReference MedianOdds RatioChi2BelowAbove
Candidatus Amoebophilus asiaticusspecies0.0160.4430725471120
Candidatus Amoebophilusgenus0.0160.4430725471120
Oscillatoria corallinaespecies0.0030.32247.4874276
Oscillatoriagenus0.0030.32247.4874276
Parabacteroides goldsteiniispecies0.3190.49237.725581260
Rhodothermusgenus0.0340.49230.324541213
Rhodothermus clarusspecies0.0340.49230.224521212
Paenibacillusgenus0.0030.39200.81001394
Granulicatellagenus0.00252.251925701280
Listeriagenus0.0030.29190.5563162
Listeria innocuaspecies0.0030.29189.2561162
Acidaminobacter hydrogenoformansspecies0.0030.35185.2721252
Acidaminobactergenus0.0030.35184.7722253
Candidatus Glomeribactergenus0.0040.45182.11264575
Psychrobacter glacialisspecies0.0020.37157.7667249
Niabella aurantiacaspecies0.0020.34151.1538182
Methylonatrumgenus0.0040.54145.21632875
Methylonatrum kenyensespecies0.0040.54145.21632875
Hymenobacter xinjiangensisspecies0.0070.53139.51482788
Niabellagenus0.0020.38133.8578222

More or Less often based on Symptom Median High Incidence

Above we see that many of the top bacteria identified are sparse, that is not reported often. We then restrict them to those that occur above 50% or the time.

tax_nameRankSymptom Median FreqOdds RatioChi2BelowAbove
Clostridium taeniosporumspecies0.0030.618.91353820

More or Less often based on Reference Median High Incidence

Above we see that many of the top bacteria identified are sparse, that is not reported often. We then restrict them to those that occur above 50% or the time.

tax_nameRankReference Median FreqOdds RatioChi2BelowAbove
Candidatus Amoebophilusgenus0.0160.4430725471120
Candidatus Amoebophilus asiaticusspecies0.0160.4430725471120
Oscillatoriagenus0.0030.32247.4874276
Oscillatoria corallinaespecies0.0030.32247.4874276
Parabacteroides goldsteiniispecies0.3190.49237.725581260
Rhodothermusgenus0.0340.49230.324541213
Rhodothermus clarusspecies0.0340.49230.224521212
Paenibacillusgenus0.0030.39200.81001394
Granulicatellagenus0.00252.251925701280
Listeriagenus0.0030.29190.5563162
Listeria innocuaspecies0.0030.29189.2561162
Acidaminobacter hydrogenoformansspecies0.0030.35185.2721252
Acidaminobactergenus0.0030.35184.7722253
Candidatus Glomeribactergenus0.0040.45182.11264575
Psychrobacter glacialisspecies0.0020.37157.7667249
Niabella aurantiacaspecies0.0020.34151.1538182
Methylonatrumgenus0.0040.54145.21632875
Methylonatrum kenyensespecies0.0040.54145.21632875
Hymenobacter xinjiangensisspecies0.0070.53139.51482788
Niabellagenus0.0020.38133.8578222

Summary

A large number of bacterial taxa exhibit shifts with P < 0.01 in association with this condition. The subsequent challenge is determining how to modulate these taxa, since the volume of candidates exceeds what most individuals can practically consider. Moreover, for many of the taxa identified, there is no published evidence in the U.S. National Library of Medicine describing how to alter their abundance.

A deep optimization model, such as the one implemented on the Microbiome Taxa R2 site, can be used to inform probiotic selection. This model provides coverage for each identified taxon and infers which probiotics are most likely to shift their levels. Its output may then be integrated with more conventional recommendations derived from literature indexed in the U.S. National Library of Medicine where such evidence exists, with the two recommendation sets reconciled by giving priority to probiotic-based suggestions.

Development of a dedicated database based on Biomesight samples is in progress. The current model uses data contributed by PrecisionBiome, and datasets generated with differing laboratory processing pipelines cannot be safely combined, as discussed in The taxonomy nightmare before Christmas…. Once the Biomesight-specific database is complete, an option for generating (offline-only) personalized suggestions will be added to the Microbiome Prescription website.

Probiotics Suggestions

The following are based on a simplified algorithm using R2 data for Biomesight. These are tentative numbers subject to future refinements. Bacteria listed are only for probiotics detected with Biomesight tests. Probiotics include some that are available only in some countries and some that are pending approval for retail sale.

  • Good Count: Number of bacteria expected to shift in desired direction
  • Bad Count: Number of bacteria expected to shift in wrong direction
  • Impact: Estimator of impact based on Chi-2, Slope and R2 vectors
Probiotic SpeciesImpactGood CountBad Count
Bifidobacterium breve62.66150
Bifidobacterium longum56.01150
Enterococcus faecalis54.65827
Bifidobacterium adolescentis41.58130
Lactobacillus johnsonii34.135129
Bifidobacterium bifidum12.62110
Bifidobacterium catenulatum11.3491
Enterococcus faecium10.411714
Segatella copri5.9510
Bifidobacterium animalis5.6870
Streptococcus thermophilus3.360
Veillonella atypica1.16160
Pediococcus acidilactici1.124514
Clostridium butyricum0.98203
Enterococcus durans0.95366
Lactococcus lactis0.3863
Lactobacillus jensenii0.162126
Ligilactobacillus salivarius0.0773
Lacticaseibacillus paracasei0.07717
Lacticaseibacillus casei-0.117
Lactiplantibacillus pentosus-0.11516
Limosilactobacillus fermentum-0.161519
Lactiplantibacillus plantarum-0.1707
Lactobacillus crispatus-0.18212
Leuconostoc mesenteroides-0.3386
Lacticaseibacillus rhamnosus-0.34123
Bacillus subtilis-0.392542
Lactobacillus acidophilus-0.541414
Heyndrickxia coagulans-0.741334
Limosilactobacillus reuteri-0.823029
Odoribacter laneus-0.8203
Limosilactobacillus vaginalis-1.112840
Bifidobacterium pseudocatenulatum-1.171116
Lactobacillus helveticus-2.193479
Escherichia coli-2.2946
Bacteroides uniformis-4.1334
Bacteroides thetaiotaomicron-4.7634
Blautia wexlerae-37.7716
Akkermansia muciniphila-50.11030
Parabacteroides goldsteinii-67.85018
Parabacteroides distasonis-111.5306
Blautia hansenii-130.51027
Faecalibacterium prausnitzii-378.8529

Odds Ratio Snapshots: Official Diagnosis: Chronic Fatigue Syndrome (CFS/ME)

This document presents the results of statistical analysis on symptoms from viable, self-annotated Biomesight microbiome samples. The methodology for data acquisition is outlined in New Standards for Microbiome Analysis?.

Tables have been refined to display only genus- and species-level taxa, the 20 most prominent entries per group, and associations achieving statistical significance (P < 0.01).

The following sections provide the processed data, accompanied by guidance on interpretation and application. Counts of significant bacterial taxa are included, reflecting the application of non-standard but rigorously validated statistical approaches to extensive sample and reference populations, where statistical power derives from dataset scale

SignificanceGenus
p < 0.01239
p < 0.001206
p < 0.0001184
p < 0.00001164

Below is a walkthru that may help some people understand the statistics.

Averages and Medians

I prefer medians over averages. Medians are the values where half of the people have less and half has more. If the data was a bell-curve, then the values will almost be the same… with bacteria that happens rarely. Look at Phocaeicola below, we see that the average is above and the median below.

If symptom median is higher than reference median, it means there is more of this bacteria. If lower, then less. This ignores how often the bacteria is seen (we average only over reports).

tax_nameRankSymptom AvarageReference AverageSymptom MedianReference Median
Phocaeicolagenus9.81610.9619.4838.286
Blautiagenus9.8058.3237.1017.832
Bacteroides uniformisspecies3.0572.6991.5122.029
Oscillospiragenus2.7512.3161.9252.255
Parabacteroidesgenus2.6042.6271.7142.007
Bacteroides cellulosilyticusspecies1.1450.8240.070.218
Clostridiumgenus2.0931.8351.3591.501
Pedobactergenus1.1340.9860.5450.647
Ruminococcus bromiispecies0.8240.7880.160.261
Bacteroides caccaespecies1.0790.8550.2820.371
Akkermansia muciniphilaspecies1.7891.3150.0470.132
Akkermansiagenus1.7891.3140.0470.132
Blautia hanseniispecies1.0931.0330.7130.786
Bifidobacteriumgenus0.6270.9650.1330.061
Bilophilagenus0.3740.3480.2060.275
Bacteroides rodentiumspecies0.4840.3820.1830.234
Sutterella wadsworthensisspecies0.6470.660.060.012
Bilophila wadsworthiaspecies0.3550.340.1980.241
Acetivibriogenus0.3570.2590.0990.141
Acetivibrio alkalicellulosispecies0.3430.250.0940.134

Bacteria Incidence – How often is it reported

The common sense belief is that if a bacteria is reported more often, then the amount should be higher. This is often not true. The microbiome is a complex thing. Look at Bacteroides uniformis below, we see that the average is above and the median below.

tax_nameRankIncidence Odds RatioChi2Symptoms %Reference %
Ethanoligenensgenus1.3512.462.946.6
Porphyromonas asaccharolyticaspecies1.618.731.719.8
Mogibacterium vescumspecies1.6821.329.217.4
Dehalobacteriumgenus1.318.749.537.7
Acholeplasma hippikonspecies1.491433.522.5
Aggregatibactergenus0.5615.31424.8
Anaerococcusgenus1.297.446.435.9
Peptoniphilus asaccharolyticusspecies1.37.444.734.4
Slackia faecicanisspecies1.358.738.828.8
Sporosarcina pasteuriispecies1.6717.523.614.1
Finegoldia magnaspecies1.296.742.432.9
Sporosarcinagenus1.6416.223.614.4
Shewanella upeneispecies1.347.43324.7
Meiothermusgenus1.347.231.223.3
Meiothermus granaticiusspecies1.347.130.722.9
Actinobacillus pleuropneumoniaespecies0.5810.710.918.7
Varibaculumgenus1.5310.820.613.4
Halanaerobiumgenus1.428.223.416.4
Anaerococcus vaginalisspecies1.377.225.618.7
Erysipelothrix inopinataspecies1.478.619.813.4

More or Less often based on Symptom Median All Incidence

This is a little more complex to understand. If we compute the mid point for people with the symptom, then if the bacteria was not involved then half of the reference should be above this value and half below this value. If not, it means that the symptom tends to over or under growth.

tax_nameRankSymptom MedianOdds RatioChi2BelowAbove
Isoalcanivoraxgenus0.0020.2582.435088
Isoalcanivorax indicusspecies0.0020.2582.435088
Alcanivoraxgenus0.0020.2681.935992
Salidesulfovibriogenus0.0020.370371110
Salidesulfovibrio brasiliensisspecies0.0020.370371110
Niabella aurantiacaspecies0.0020.3369.1507169
Psychroflexusgenus0.0020.366.1348105
Psychroflexus gondwanensisspecies0.0020.366.1348105
Deferribacter autotrophicusspecies0.0020.3164.6360112
Deferribactergenus0.0020.3163.7362114
Pelagicoccus croceusspecies0.0020.3261.9368119
Psychrobacter glacialisspecies0.0020.3860.9622235
Rickettsia marmionii Stenos et al. 2005species0.0020.3458.8372125
Bacillus ferrariarumspecies0.0020.3358.7354117
Segetibacter aerophilusspecies0.0020.3358.5360120
Niabellagenus0.0020.3955.5540208
Segetibactergenus0.0020.3554.9362126
Actinopolysporagenus0.0020.3854.7509195
Lentibacillusgenus0.0020.3853.8484185
Lentibacillus salinarumspecies0.0020.3852.9468179

More or Less often based on Reference Median All Incidence

This is like the above, but with a different line in the sand. Instead of the median of those with the condition, we use the median of the reference set.

tax_nameRankReference MedianOdds RatioChi2BelowAbove
Methylobacillus glycogenesspecies0.0030.4215.71186478
Methylobacillusgenus0.0030.42201.41185496
Streptococcus oralisspecies0.0030.47177.91355632
Erysipelothrix murisspecies0.0150.53167.120601096
Desulfotomaculumgenus0.0040.49156.31370678
Erysipelothrixgenus0.0150.5514820611143
Niabella aurantiacaspecies0.0020.33145.2507169
Psychrobacter glacialisspecies0.0020.38144.7622235
Alcanivoraxgenus0.0020.26142.535992
Isoalcanivoraxgenus0.0020.25141.635088
Isoalcanivorax indicusspecies0.0020.25141.635088
Caloramator fervidusspecies0.0450.5813121311235
Salidesulfovibriogenus0.0020.3126.8371110
Salidesulfovibrio brasiliensisspecies0.0020.3126.8371110
Porphyromonasgenus0.0120.58125.119741145
Niabellagenus0.0020.39124.6540208
Actinopolysporagenus0.0020.38119.5509195
Psychroflexusgenus0.0020.3117.4348105
Psychroflexus gondwanensisspecies0.0020.3117.4348105
Deferribacter autotrophicusspecies0.0020.31116.8360112

More or Less often based on Symptom Median High Incidence

Above we see that many of the top bacteria identified are sparse, that is not reported often. We then restrict them to those that occur above 50% or the time.

tax_nameRankSymptom Median FreqOdds RatioChi2BelowAbove
Clostridium taeniosporumspecies0.0030.621.71272762
Dethiosulfovibriogenus0.0040.6515.51446943
Tetragenococcus doogicusspecies0.0030.6614.91290845
Hydrocarboniphaga daqingensisspecies0.0040.711.315311065
Mycoplasmopsisgenus0.0050.729.616811206
Pediococcusgenus0.0040.728.61222885
Tetragenococcusgenus0.0030.747.61268938
Carboxydocella ferrireducensspecies0.0040.756.81215912

More or Less often based on Reference Median High Incidence

Above we see that many of the top bacteria identified are sparse, that is not reported often. We then restrict them to those that occur above 50% or the time.

Methylobacillus glycogenesspecies0.0030.4215.71186478
Methylobacillusgenus0.0030.42201.41185496
Streptococcus oralisspecies0.0030.47177.91355632
Erysipelothrix murisspecies0.0150.53167.120601096
Desulfotomaculumgenus0.0040.49156.31370678
Erysipelothrixgenus0.0150.5514820611143
Niabella aurantiacaspecies0.0020.33145.2507169
Psychrobacter glacialisspecies0.0020.38144.7622235
Alcanivoraxgenus0.0020.26142.535992
Isoalcanivoraxgenus0.0020.25141.635088
Isoalcanivorax indicusspecies0.0020.25141.635088
Caloramator fervidusspecies0.0450.5813121311235
Salidesulfovibriogenus0.0020.3126.8371110
Salidesulfovibrio brasiliensisspecies0.0020.3126.8371110
Porphyromonasgenus0.0120.58125.119741145
Niabellagenus0.0020.39124.6540208
Actinopolysporagenus0.0020.38119.5509195
Psychroflexusgenus0.0020.3117.4348105
Psychroflexus gondwanensisspecies0.0020.3117.4348105
Deferribacter autotrophicusspecies0.0020.31116.8360112

Summary

A large number of bacterial taxa exhibit shifts with P < 0.01 in association with this condition. The subsequent challenge is determining how to modulate these taxa, since the volume of candidates exceeds what most individuals can practically consider. Moreover, for many of the taxa identified, there is no published evidence in the U.S. National Library of Medicine describing how to alter their abundance.

A deep optimization model, such as the one implemented on the Microbiome Taxa R2 site, can be used to inform probiotic selection. This model provides coverage for each identified taxon and infers which probiotics are most likely to shift their levels. Its output may then be integrated with more conventional recommendations derived from literature indexed in the U.S. National Library of Medicine where such evidence exists, with the two recommendation sets reconciled by giving priority to probiotic-based suggestions.

Development of a dedicated database based on Biomesight samples is in progress. The current model uses data contributed by PrecisionBiome, and datasets generated with differing laboratory processing pipelines cannot be safely combined, as discussed in The taxonomy nightmare before Christmas…. Once the Biomesight-specific database is complete, an option for generating (offline-only) personalized suggestions will be added to the Microbiome Prescription website.

Probiotics Suggestions

The following are based on a simplified algorithm using R2 data for Biomesight. These are tentative numbers subject to future refinements. Bacteria listed are only for probiotics detected with Biomesight tests. Probiotics include some that are available only in some countries and some that are pending approval for retail sale.

  • Good Count: Number of bacteria expected to shift in desired direction
  • Bad Count: Number of bacteria expected to shift in wrong direction
  • Impact: Estimator of impact based on Chi-2, Slope and R2 vectors
Probiotic SpeciesImpactGood CountBad Count
Bifidobacterium breve6.3310
Bacteroides thetaiotaomicron6.2210
Bifidobacterium longum6.1410
Bifidobacterium adolescentis4.7910
Bacteroides uniformis4.2110
Lactobacillus helveticus3.61310
Enterococcus faecalis2.8888
Pediococcus acidilactici2.4337
Bifidobacterium bifidum1.7110
Bifidobacterium catenulatum1.0710
Bifidobacterium animalis0.7110
Segatella copri0.5310
Bacillus subtilis0.2926
Veillonella atypica0.0910
Heyndrickxia coagulans0.0612
Limosilactobacillus fermentum-0.0112
Bacillus-0.0101
Pediococcus-0.0101
Leuconostoc mesenteroides-0.0101
Ligilactobacillus salivarius-0.0213
Lacticaseibacillus rhamnosus-0.0201
Lactiplantibacillus pentosus-0.0201
Lactiplantibacillus plantarum-0.0201
Bacillus subtilis group-0.0201
Lacticaseibacillus casei-0.0302
Enterococcus faecium-0.0415
Lacticaseibacillus paracasei-0.0503
Bifidobacterium pseudocatenulatum-0.0504
Lactobacillus crispatus-0.0614
Clostridium butyricum-0.0601
Lactobacillus acidophilus-0.116
Enterococcus durans-0.1314
Limosilactobacillus vaginalis-0.1807
Bacillus amyloliquefaciens group-0.1908
Lactobacillus johnsonii-0.2127
Limosilactobacillus reuteri-0.2415
Odoribacter laneus-0.3401
Lactobacillus jensenii-0.43111
Parabacteroides goldsteinii-5.403
Akkermansia muciniphila-11.4906
Parabacteroides distasonis-14.9401
Blautia wexlerae-15.4901
Blautia hansenii-18.3203

Safe Probiotics for ME/CFS, IBS, IBD etc. from Complex Data Model

This is a brief post that draws on the analytical approach from the methodology used in Mast Cell Activation Syndrome and Multiple Chemical Sensitivity. Atypically, we are able to determine which probiotics are likely better than others. Rather than delve into the technical details—which can overwhelm those experiencing brain fog—I’m going straight to the results for this set of symptoms:

  • ME/CFS – not specific
  • ME/CFS – with IBS
  • ME/CFS – without IBS
  • IBS
  • Long COVID
  • IBD
  • Crohn’s Disease

We are filtering to P < 0.0001 (ZScore of +/-3.72). We are also restricting to strictly safe, that is no predicted inappropriate shifts to keep the list shorted and easier to handle for the brain fogged.

The Good Count below are the number of bacterium that it has the desired effect upon. The Good value is an estimate of the amount of influence.

  • The Good Count is the number of bacteria that are likely to shift in a positive direction direction.
  • Good is an scaled aggregation of the R2 values for these bacteria. One bactieria may have a R2 and slope of (.9 and 1.5) another of (.2 and 5). The result is .9 * 1.5 + .2 * 5 =2.35.

ME/CFS (General)

NameGoodGood Count
Clostridium beijerinckii1369
Niallia circulans795

This is not unexpected because the vagueness of description results in loss of clarity.

Condition: ME/CFS with IBS

NameGoodGood Count
Bifidobacterium adolescentis167861
Bifidobacterium catenulatum110840
Bifidobacterium bifidum75031
Clostridium beijerinckii1369
Niallia circulans795

Condition: ME/CFS without IBS

NameGoodGood Count
Lactococcus lactis76535
Clostridium beijerinckii1369
Niallia circulans795

Irritable Bowel Syndrome

NameGoodGood Count
Christensenella minuta279698
Enterococcus faecium233493
Anaerobutyricum hallii231793
Lactococcus cremoris190977
Bifidobacterium adolescentis167861
Blautia wexlerae164571
Bifidobacterium catenulatum110840
Lactococcus lactis76535
Bifidobacterium bifidum75031
Clostridium beijerinckii1369
Niallia circulans795

Long COVID

NameGoodGood Count
Christensenella minuta279698
Enterococcus faecium233493
Anaerobutyricum hallii231793
Lactococcus cremoris190977
Bifidobacterium adolescentis167861
Blautia wexlerae164571
Bifidobacterium catenulatum110840
Lactococcus lactis76535
Bifidobacterium bifidum75031
Clostridium beijerinckii1369
Niallia circulans795

Inflammatory Bowel Disease (IBD)

NameGoodGood Count
Enterococcus faecium233493
Lactococcus cremoris190977
Bifidobacterium adolescentis167861
Bifidobacterium catenulatum110840
Lactococcus lactis76535
Bifidobacterium bifidum75031
Clostridium beijerinckii1369
Niallia circulans795

Crohn’s Disease

NameGoodGood Count
Christensenella minuta279698
Enterococcus faecium233493
Anaerobutyricum hallii231793
Lactococcus cremoris190977
Bifidobacterium adolescentis167861
Blautia wexlerae164571
Bifidobacterium catenulatum110840
Lactococcus lactis76535
Bifidobacterium bifidum75031
Clostridium beijerinckii1369
Niallia circulans795

Summary

This feature will not be added to the web site because the computations has taken hours to run and require a large amount of memory (most of the 32 GB available). In general, too low amounts dominated as the most significant pattern. It is not killing off high bacteria but encouraging low bacteria that seems to apply for these conditions.

It is interesting to note that Lactobacillus never appears. You may notice that some conditions are very similar which is not unexpected to me. There are commonality of low bacteria across conditions.

Note: ME/CFS With IBS suggestions include ME/CFS and IBS suggestions. IBS and IBD have some similarity but are different. Crohn’s disease seems more likely to be a progression of IBS and not IBD. The data model may be useful for seeing likely disease progression paths.

Long COVID – Current research is a hunt for the holy grail…

This evening on NPR News, I saw their story on Long COVID and pending work. You may view the segment here. From watching ME/CFS research for several decades, “I wept” for Long COVID patients — I do not expect any of this planned work to produce relief to patients.

The video below are my feeling about what Long COVID is, how to approach detection and treatment.

Key Points

  • Like with another post-infection syndrome, Myalgic encephalomyelitis/chronic fatigue syndrome (ME/CFS), decades of research has failed to find a magical single key factor nor an effective new drug to treat.
    • Their core assumption is that there must a simple single factor
    • The reality is that there are dozens of factors with commonality across patients, they are also highly individual factors.
  • Studies have constantly shown microbiome dysbiosis as a signature. A large number are shifted. What is reported in studies can be reviewed here.
  • We can see this in contributed microbiome samples from people with Long COVID. You can see those shifts on this page.
  • There are clinical issues with this approach — because of a lack of standardization of microbiome tests used in studies and clinics. See this post. There are issues which can be resolved with some effort.

Looking at bacteria from different labs, we find almost no agreement. If we use KEGG data on samples from different labs, we end up with agreement on which metabolites are abnormal across different labs.

We have demonstrated the ability to accurately predict Long COVID from microbiome samples as shown by a patient agreement with the predicted symptoms illustrated below:

We are able to generate suggestions of probiotics, supplements, etc that will reduce the symptoms with a high success rate.

Some Case Studies are here. An example of an individual protocol is Treatment Suggestions for Long COVID.

IMHO: Researchers are looking for answers in their expertise. The answers are there, there are just few people with the appropriate expertise.